Visualization
Visualization
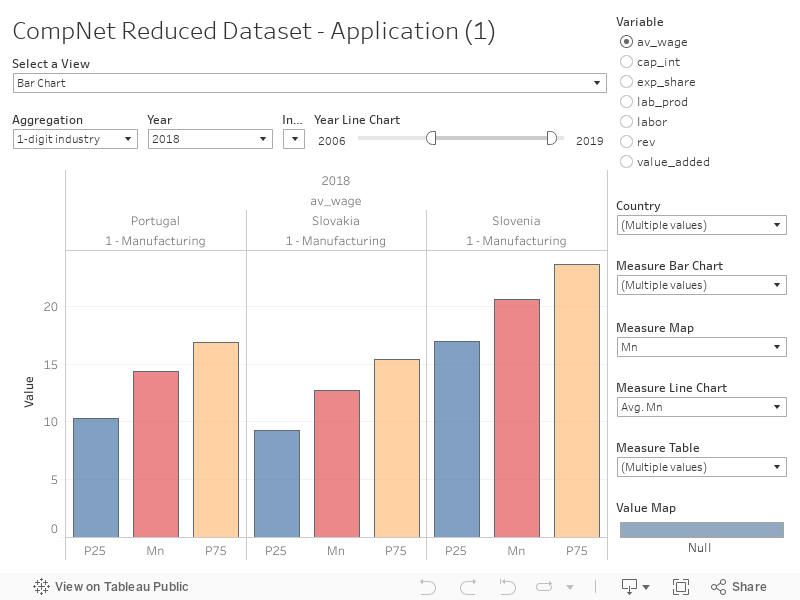
Below you can see a first application of the data visualization created using the CompNet Reduced Dataset. On the top of the graphs, there is a filter called “select a view” in which everyone can choose the preferred visualization between bar chart, map, line chart, and table. The visualization is a living tool and will grow over time.
Documents
Here you can find the country reports
Here you can find some more information on the 8th vintage use
The 8th vintage is the latest CompNet dataset on micro-aggregated firm-level data. The link provided, you can find information on how to generate, interpret and compare results about labor productivity as well as other indicators. The 9th vintage will be available soon.
Training
Here you can find documentation, the definitions of variables, and the reduced dataset used for visualizations. The Reduced Dataset is a carefully cleaned subset of the CompNet dataset that contains a few critical variables for policy-oriented users.
Here you can find access on the reduced dataset training. The link will provide assistance on how to start analyzing the essential parts of the CompNet dataset.